Life Expectancy Analysis
A statistical regression study validated with both a holdout split and 5-fold cross-validation.
The Problem
Which socioeconomic and political factors actually predict a country's life expectancy, and how much does each matter once you control for the others? This is a real applied-statistics problem, and doing it rigorously means being careful about model selection and validation, not just fitting one regression and reporting R².
The Approach
Built a multiple linear regression model in R on 165 countries' CIA World Factbook data, engineering log-transforms for skewed predictors and a transportation-infrastructure interaction term, then cross-checked model selection across three independent criteria (Mallows' Cp, AIC, BIC) before validating the final model two separate ways.
Try It Live
Drag the sliders to plug in a country's statistics and see what the actual fitted 6-predictor model (adjusted R²=0.891) predicts for life expectancy — these are the real coefficients from the regression above, not illustrative numbers.
The model's real cross-validated error is about ±2.6 years (RMSE), so treat this as a point estimate, not a precise forecast.
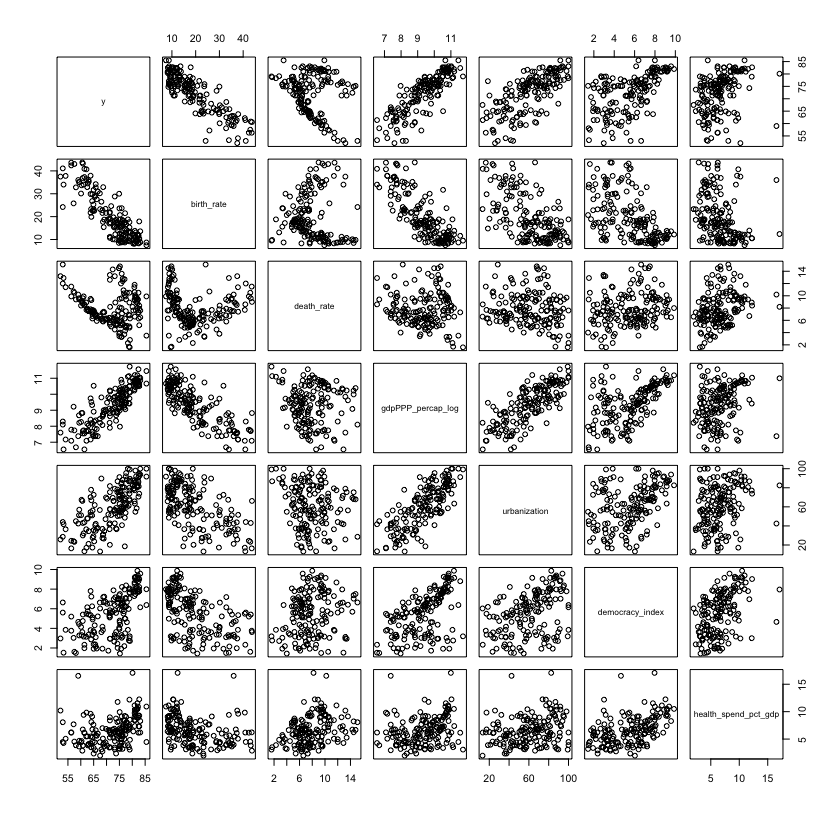
- ▹Final model (6 predictors, chosen via BIC): birth_rate, death_rate, log(GDP PPP per capita), urbanization, democracy_index, health_spend_pct_gdp
- ▹Adjusted R² = 0.891, F = 224.5 on 6 and 158 df (p < 2.2×10⁻¹⁶), residual standard error = 2.624
Highlights
- ▹Cross-checked model selection using three independent criteria (Cp, AIC, BIC) rather than trusting a single metric — AIC agreed with Cp on a 12-predictor model, but the smaller BIC-selected 6-predictor model was chosen for parsimony
- ▹Engineered a real interaction term (airports + roadways, log-transformed) as a combined transportation-infrastructure proxy, explicitly justified in the write-up
- ▹Validated the final model two independent ways — an 80/20 holdout split and a separate 5-fold cross-validation — and got consistent results across both
- ▹Full residual diagnostics: studentized deleted residuals plotted against every predictor, fitted values, and observation order, plus a Q-Q plot to check normality
Results
The final 6-predictor model explains 89.1% of the variance in national life expectancy (adjusted R², F=224.5, p<2.2×10⁻¹⁶) and predicts held-out countries' life expectancy within about 2.6 years on average (RMSE), with consistent results across both an 80/20 holdout split and independent 5-fold cross-validation.